

JoyaGoo Spreadsheet guide to one delivery record: a rate, four bins, no dates
One line object, two numbers that matter, and four questions it leaves open. Worked through on US-air-F and EMS-US with the raw reply beside each step.
A delivery rate and four bins, and nothing else
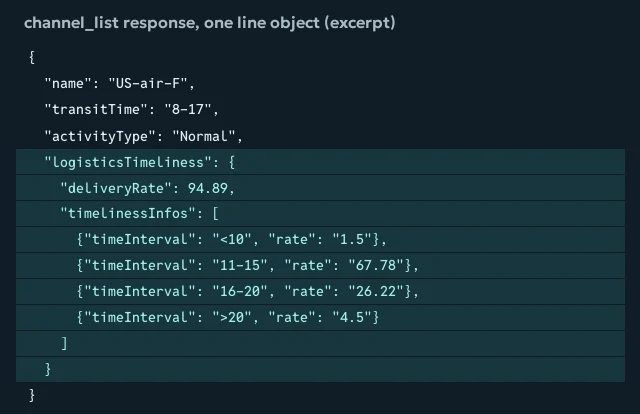
Strip away the price fields and the description, and a line’s timing data is small. Under logisticsTimeliness there is deliveryRate, a single percentage, and timelinessInfos, a list of four entries, each with a timeInterval label such as “11-15” and a rate such as “67.78”.
There is no date, no count of parcels, no destination, no definition of either number. The line object around it adds only the card window (transitTime, for example “8-17”) and a badge field (activityType) that reads “Recommend” on four lines and “Normal” on the rest.
The excerpt shown here is the US-air-F entry from our 17 October 2026 pull, trimmed to the timing fields. Note that the shares arrive as text strings (“67.78” in quotes) while the delivery rate arrives as a number, a difference in data types that does not establish how the figures were produced.
Why the bins and the rate do not add up together
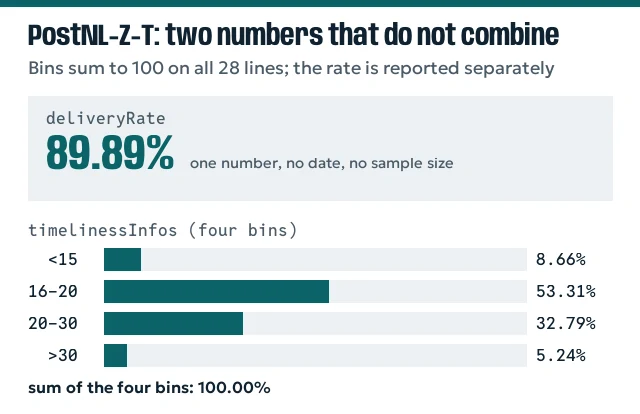
On every one of the 28 lines, the four bins add up to exactly 100. US-air-F: 1.5 + 67.78 + 26.22 + 4.5. PostNL-Z-T: 8.66 + 53.31 + 32.79 + 5.24. So the bins describe how some group of parcels spread over time, and that group is complete at 100 percent.
The delivery rate is a different figure: 94.89 for US-air-F, 89.89 for PostNL-Z-T. The two figures may use different denominators or definitions. A normalised set of bins can total 100 without explaining whether missing, returned or refused parcels were included. JoyaGoo does not supply enough information to choose a denominator.
In practice: do not multiply them, and do not read 67.78 percent as “two in three of my parcels arrive in 11 to 15 days”. It is a share of an undefined source group, not a personal arrival probability.
Worked reading: US-air-F
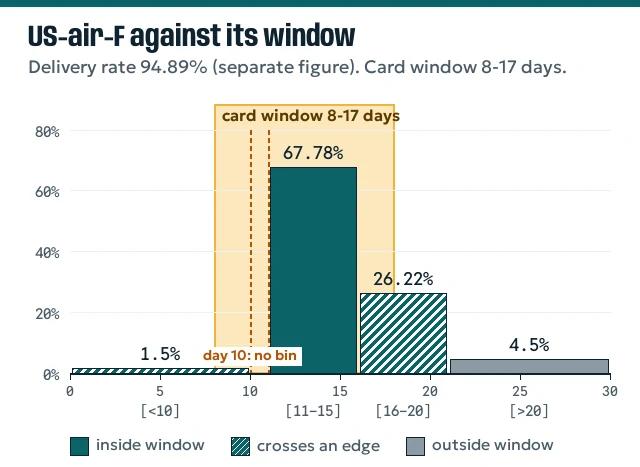
US-air-F is the first of the four lines the US card lists, and the only US line whose bins skip a day. Its card shows 8 to 17 days. Its bins: 1.5 percent under 10 days, 67.78 percent at 11 to 15, 26.22 percent at 16 to 20, 4.5 percent over 20.
Against the window, the 11 to 15 bin is wholly inside. The 16 to 20 bin crosses the closing edge: its share could contain days 16 or 17 inside the window, days 18 to 20 outside it, or a mixture. The under-10 bin could also contain days 8 or 9 inside. The record does not provide either split. The 4.5 percent over 20 days is wholly outside. Day 10 belongs to no bin at all.
So the most a careful reader can say is: between 67.78 and 95.5 percent of the reported bin shares could fall inside the card window under the literal whole-day reading, with a delivery rate of 94.89 percent standing beside that. The line’s own note adds that tracking updates in the United States typically come within 7 to 13 days after arrival.
Worked reading: EMS-US, where most of the record crosses the card's edge
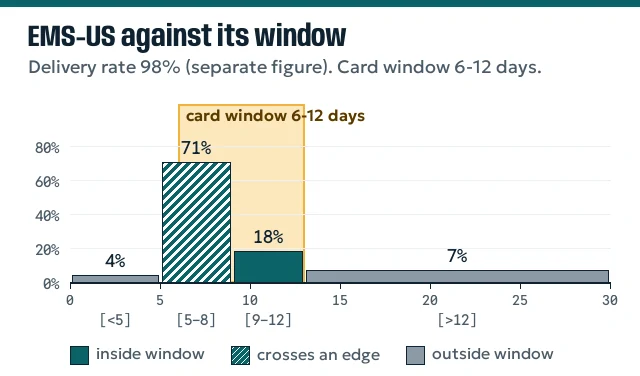
EMS-US shows a narrow window of 6 to 12 days and whole-number bins: 4 percent under 5 days, 71 percent at 5 to 8, 18 percent at 9 to 12, and 7 percent over 12. The delivery rate is a round 98.
The biggest bin, 5 to 8 days, starts one day before the window opens. The record does not say how much is inside, so the honest split is 18 percent wholly inside, 71 percent across the opening edge, 11 percent wholly outside (4 before, 7 after).
This is the opposite problem to US-air-F. There the bins ran late against the window; here they start early. In both cases the card window and the bins were clearly not cut from the same rule, which is the whole subject of Card window.
Whole numbers on some lines, two decimals on others
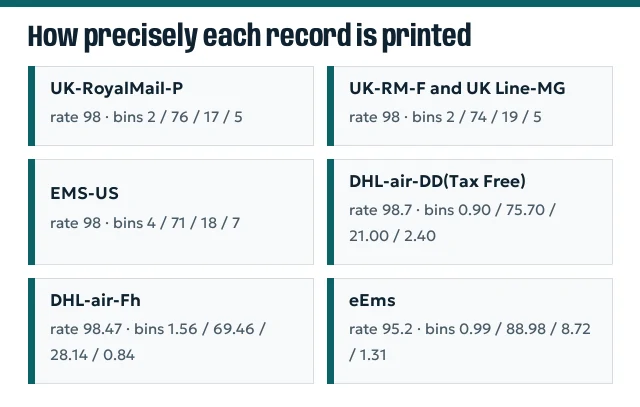
Four lines print their bins as whole numbers: UK-RoyalMail-P (2, 76, 17, 5), UK-RM-F and UK Line-MG (2, 74, 19, 5), and EMS-US (4, 71, 18, 7). All four also show a delivery rate of exactly 98. The other 24 lines print up to two decimals, and two of them, DHL-air-DD(Tax Free) and DHL-air-TM, even keep trailing zeros such as “0.90” and “75.70”.
Different decimal precision is visible, but it is not proof of a different measurement method or better accuracy. Neither a round 98 nor a two-decimal 98.47 has a published sample definition.
The readings log will note it if these round figures ever change, which would hint at how often they are refreshed.
Seeing the record in your own browser
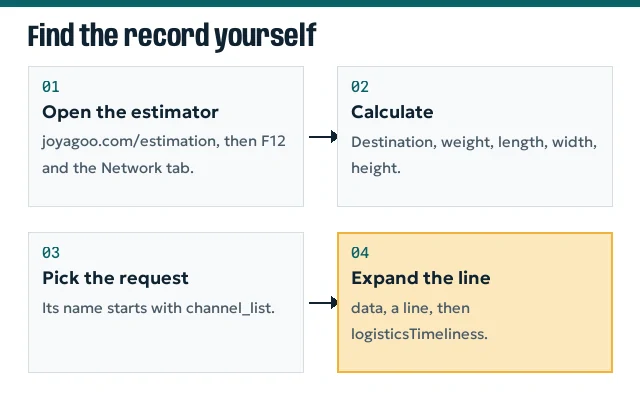
You do not need to trust our copy. In a desktop browser:
- Open the JoyaGoo shipping estimator and press F12 to open the developer tools; choose the Network tab.
- Fill in a destination, a weight and the three dimensions, then press Calculate.
- In the Network list, click the request whose name begins with
channel_list. - Open its Response or Preview tab and expand
data, then any line, thenlogisticsTimeliness.
What you see there is what we read. If it differs from our figures, the record has been updated since 17 October 2026, and we would like to know: the address is in the footer.
Four blanks around every record
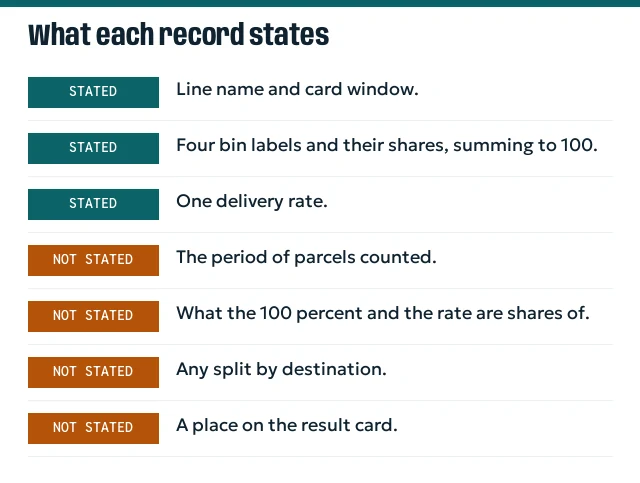
Period. No label says which dates of dispatch the figures cover, and no field changes between our readings. Two identical readings hours apart say only that nothing changed that morning.
Denominator. If disposed parcels (US-air-F disposes of parcels it cannot deliver, and charges for it) are outside both numbers, the delivery rate flatters the line. If they are inside the rate but not the bins, the reading above holds. We cannot tell which.
Destination. The same figures for every country mean a parcel to Portugal and one to Japan on PostNL-Z-T carry the same record. Your own country’s experience may differ either way.
Display. The checked result card did not show the record, and the reviewed help material did not define its sample. The reason for those omissions is unknown.
Next, the two oddities that show up once you compare records: