

JoyaGoo Spreadsheet note on line-wide records: the same figures in every country
PostNL-Z-T reads 89.89 percent in Portugal, Japan and 26 other destinations. Weight changes nothing either. These records describe a line, not your route, and some are shared by two line names.
PostNL-Z-T: one set of figures for twenty-eight countries
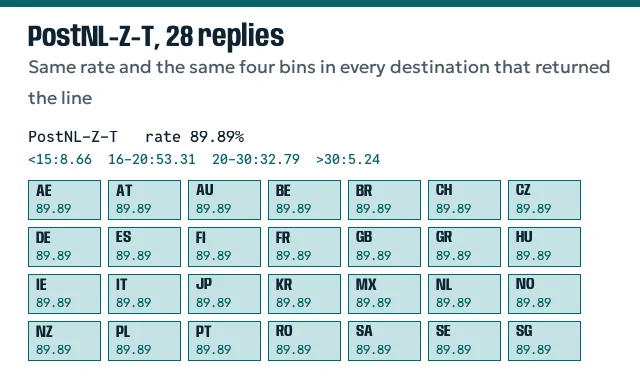
Of the 32 destinations we asked about on 17 October 2026, 28 returned PostNL-Z-T. Every one of them got the same delivery rate, 89.89 percent, and the same four bins: 8.66 percent under 15 days, 53.31 at 16 to 20, 32.79 at 20 to 30, 5.24 over 30. Portugal and Japan, Mexico and Finland, Saudi Arabia and Ireland: identical to the last decimal.
A postal line that ends with a different national post office in each country does not, in reality, deliver to all of them on the same curve. So these figures are not a measurement of your route. They are one record kept for the line as a whole and attached to every quote that includes it.
That does not make them useless. It makes them a repeated line record of unknown make-up, which is a weaker thing than they look like when you first find them.
The six DHL lines across seventeen European destinations
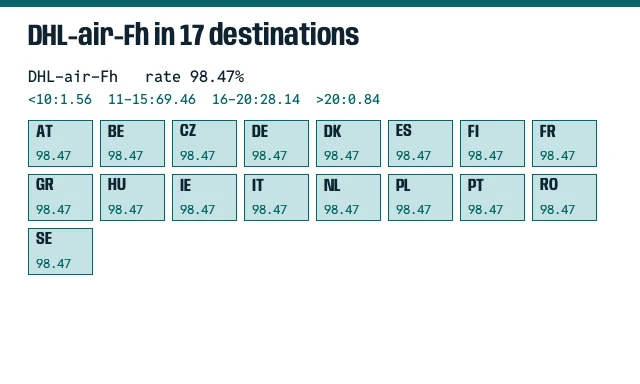
Six lines with DHL in the name (DHL-air-Fh, DHL-air-DD(Tax Free), DHL-air-TM, DHL-air-Fhbig, DHL-air-DDbig(Tax Free) and DHL-air-MGbig) came back for the same 17 European destinations: AT, BE, CZ, DE, DK, ES, FI, FR, GR, HU, IE, IT, NL, PL, PT, RO, SE. In each country the six records were the same as in every other.
Germany and Greece, Sweden and Portugal: DHL-air-Fh reads 98.47 percent with bins of 1.56, 69.46, 28.14 and 0.84 everywhere. The card window is the same too, 10 to 17 days. Only the price changes from country to country.
For a reader in Greece this matters more than for one in Germany. If the line performs differently at the far edge of its network, the record would not show it, because the record is the same for both.
Weight changes the price, not the record
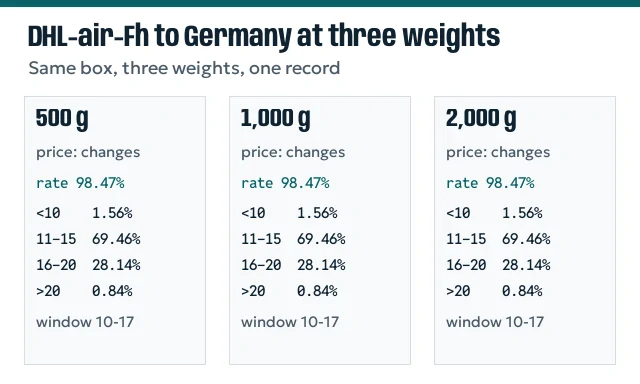
We asked for six destinations three times, at 500 g, 1,000 g and 2,000 g, with the same 30 by 20 by 10 cm box. Prices moved as you would expect. The delivery records did not move at all: not one figure on any of the 37 lines changed between the three weights.
That fits the reading above. A record kept per line has no reason to know how heavy your parcel is. It also means the record cannot tell you whether heavier parcels on a line travel more slowly, which on some lines they might, since heavier parcels can be routed differently.
If you are deciding between splitting an order into two parcels or sending one, the record will look the same either way. The price and the line notes are where the difference shows.
Two names, one set of figures
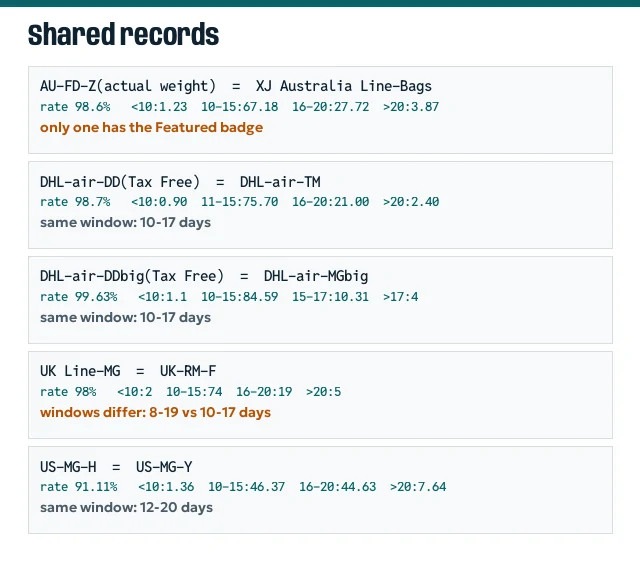
Five pairs of differently named lines share one record exactly:
- US-MG-Y and US-MG-H: 91.11 percent, bins <10: 1.36 / 10-15: 46.37 / 16-20: 44.63 / >20: 7.64.
- UK-RM-F and UK Line-MG: 98 percent, bins <10: 2 / 10-15: 74 / 16-20: 19 / >20: 5.
- DHL-air-DD(Tax Free) and DHL-air-TM: 98.7 percent, bins <10: 0.90 / 11-15: 75.70 / 16-20: 21.00 / >20: 2.40.
- DHL-air-DDbig(Tax Free) and DHL-air-MGbig: 99.63 percent, bins <10: 1.1 / 10-15: 84.59 / 15-17: 10.31 / >17: 4.
- AU-FD-Z(actual weight) and XJ Australia Line-Bags: 98.6 percent, bins <10: 1.23 / 10-15: 67.18 / 16-20: 27.72 / >20: 3.87.
The records are identical in this snapshot. That does not establish whether the lines share a sample, use a common calculation or copy a value; do not treat the two entries as independent evidence.
Same figures, different windows: UK-RM-F and UK Line-MG
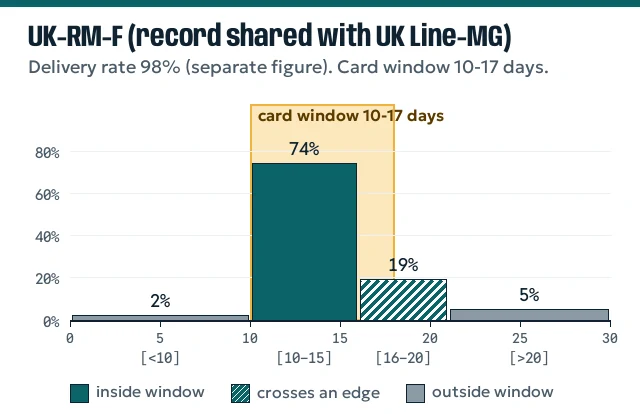
UK-RM-F and UK Line-MG are the most telling of the five pairs. Their records are identical. Their card windows are not: 10 to 17 days for UK-RM-F, 8 to 19 days for UK Line-MG.
If both statements describe real parcels, one of them is describing something other than the same parcels. The more likely story is that the windows were set separately, maybe by different people at different times, while the record was shared. Run each through the curve viewer and the shares shift: 74 percent inside for both, but 19 percent across an edge for UK-RM-F and 21 for UK Line-MG, with 2 percent below the window for the first and none for the second.
When two lines show the same record, compare their windows and notes, because that is where they actually differ.
Reading a pooled figure for your own country
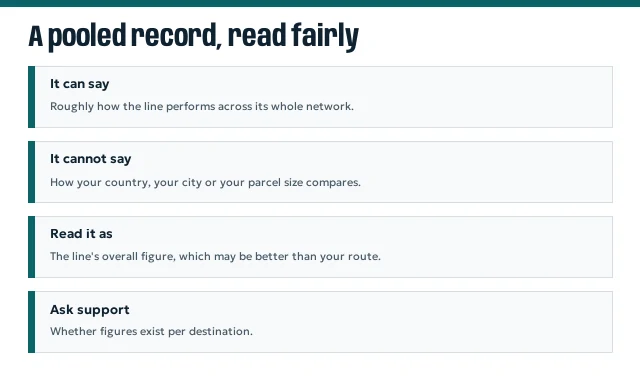
A line-wide record is still worth something. Neither 99.63 nor 89.89 can establish a failure rate for your destination without the underlying definition, sample and period.
What the pooled figure cannot do is separate a strong country from a weak one. If you live at the edge of a line’s network, a remote island or a country where the line hands over to a slower local carrier, do not assume the record is a best case, worst case or prediction for your address.
Ask JoyaGoo’s support whether it has figures for your country. The record suggests it keeps something per line; it may keep more than the estimator shows.
Related readings: